


Media Contact
Katy Payne she/her
360-764-0201
OLYMPIA—September 10, 2024—Today, the Office of Superintendent of Public Instruction (OSPI) released data from the spring 2024 state assessments. Overall, the data indicates that students are continuing a strong recovery in math and the need for a continued focus on literacy.
The tests, required each spring for students in grades 3–8 and 10, are one way of assessing the depth of each student’s knowledge and skills in math and English language arts.
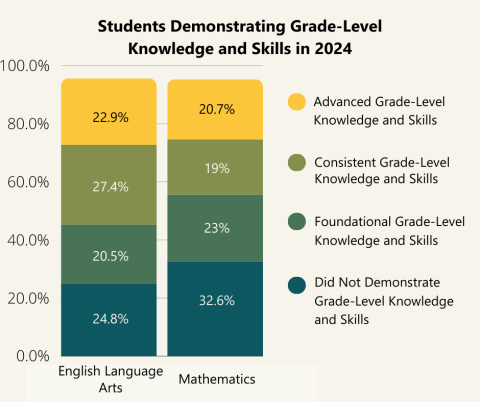
Achievement levels on the state assessment represent a range of performance. Three of the four achievement levels indicate grade-level knowledge and skills, with increasing accuracy and complexity. While Level 1 indicates achievement that is not on grade level, Level 2 indicates foundational grade-level knowledge and skills, and Levels 3 and 4 indicate a student is on track for college-level learning without needing remedial classes.
“We often see the results of these tests being miscommunicated to mean something that they don’t,” said State Superintendent Chris Reykdal. “The state tests are not Pass/Fail and students who do not meet the college readiness proficiency standard are not necessarily below grade level in their knowledge. On the tests, students demonstrate their grade-level knowledge and skills along a continuum of complexity.”
For example, in assessing reading and comprehension in the third grade, a lower score indicates that the student was able to identify central ideas in texts of low or moderate complexity and distinguish between literal and non-literal meanings of words and phrases. On the same assessment, a higher score indicates that the student could identify explicit evidence or supporting details to support basic inferences in text of moderate-to-high or unusually high complexity.
Washington students continue to perform similar to or better than students enrolled in public schools across the U.S. on the National Assessment of Educational Progress (NAEP), the nation’s only assessment where statistically sound comparisons between states can be drawn. While NAEP data have shown a steady decline in reading performance across the nation since 2017, the data continue to show that Washington’s students make gains in both math and English language arts as they progress through the K–12 education system.
On the NAEP assessment, by the 8th grade, only 7 states and the Department of Defense (DoD) schools are statistically significantly outperforming Washington students in math and only 2 states and the DoD schools are statistically significantly outperforming Washington students in reading. The data place Washington’s 8th graders in the top 15 states in the country for their math and reading abilities.
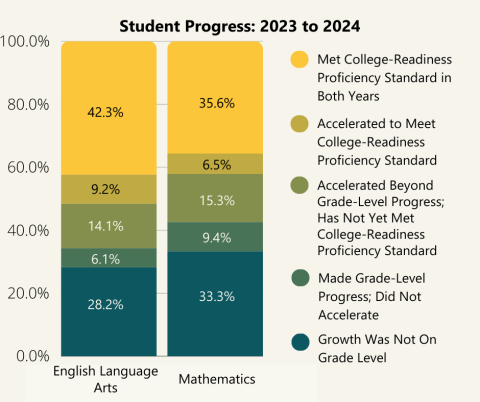
As one way of assessing student learning recovery, OSPI monitors student progress and learning acceleration, as displayed in the chart below. The bars indicate student progress from the 2023 to the 2024 assessments.
Under federal law, each state is required to administer statewide assessments in grades 3–8 and once in high school. At a system level, the data are used to identify opportunity gaps and influence investments and policy priorities to support student learning. As required by federal law, assessment data inform the level of support the state provides to each school through the Washington School Improvement Framework.
Families, policymakers, and community members should be cautious about viewing state assessment scores as the primary indicator of student learning and growth. Engagement, attendance, grades, and classroom-based assignments and tests provide more detailed, timely, and useful information about individual students' progress to their families and educators.
It should be noted that the required standardized tests aim to measure students’ knowledge and skills in one year compared to students at that grade level from the previous year. It shows overall trends and can indicate a student’s performance at one particular time, but is not designed to measure a single student’s ability and readiness over time.
Trends in the Data Over Time
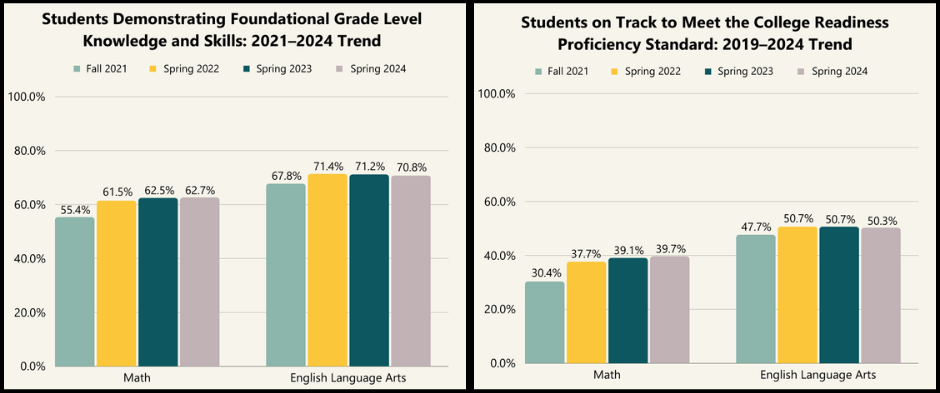
At the height of the COVID-19 pandemic in fall 2021, assessment scores in Washington dropped by several percentage points, mirroring the declines across the nation. (Note: Fall 2021 tests were not typical in their timing and length but give an indication of student learning and progress.) While test scores are not yet back to what they were pre-pandemic, the recovery in scores since 2022 are evidence of the diligent efforts by Washington’s students, educators, and families.
The chart below shows the total percentage of students who demonstrated grade-level knowledge and skills (left) as well as the total percentage of students who demonstrated knowledge and skills consistent with the college readiness proficiency standard (right) in both math and English language arts.
The math and English language arts charts below show, by grade level, the percentage of students who demonstrated grade-level knowledge and skills (left) as well as the percentage of students who demonstrated knowledge and skills consistent with the college readiness proficiency standard (right).
Math
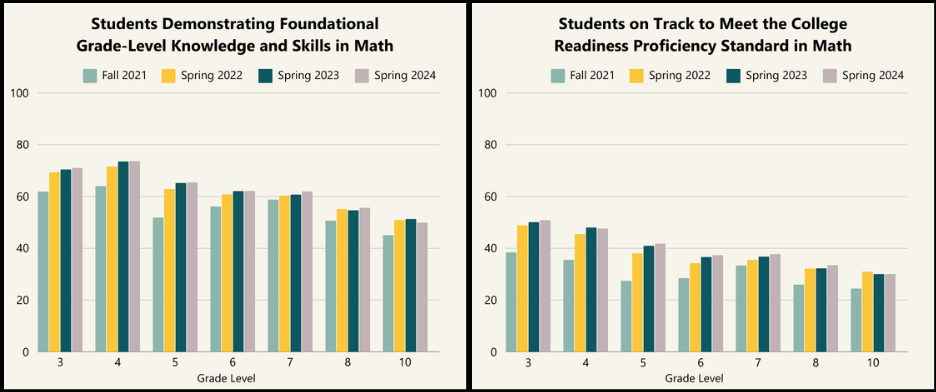
The data show continued recovery and acceleration in math at nearly all grade levels, highlighting the intentional, focused efforts of Washington’s educators to support math recovery. (It should be noted that math scores saw the largest decrease during the pandemic.)
English Language Arts
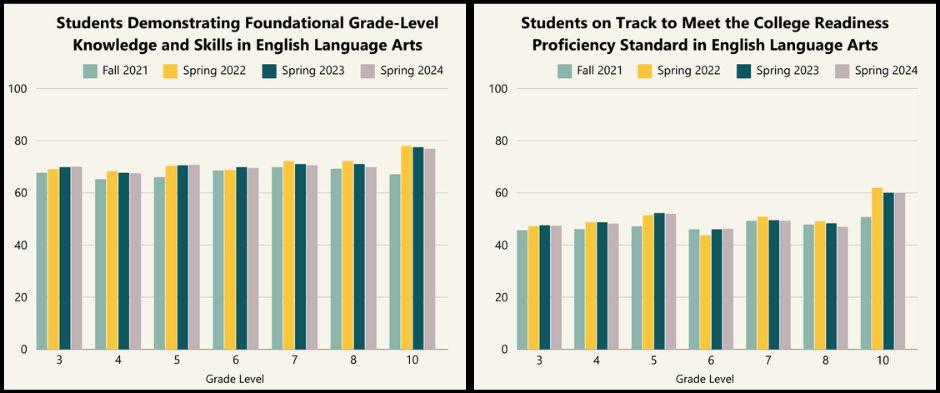
In English language arts, the data indicate the need for a renewed focus on literacy. As our world becomes more digitally connected, young people are spending less time reading as they age—in particular, less time reading complex texts. A 2023 study by Scholastic found that, from 2010 to 2022, the number of youth aged 6–17 who identified as “frequent readers” (5–7 days per week) decreased by 9 percentage points to just 28% in 2022. Young people are spending more time texting, on social media, gaming, and watching online videos, and less time reading books.
“These trends in reading are occurring across the nation, but in Washington, we can be different,” said Reykdal. “Literacy is the foundational building block to future learning across all content areas, and we are doubling down on our focus on early literacy in particular.”
Superintendent Reykdal’s 2025 budget proposal to the Governor and Legislature will include funds for an artificial intelligence (AI) reading tool where students can practice reading out loud and receive immediate, individualized analysis and feedback from the tool to support their learning. The tool will provide real-time data to each child’s teacher, supporting educators to quickly identify students who may need additional support.
Superintendent Reykdal will also be requesting funding for continued support of the Imagination Library of Washington, a global nonprofit organization created by Dolly Parton where children birth through age 5 can receive a high-quality, age-appropriate book delivered to their home each month. The program aims to support early literacy as well as provide opportunities for parents and families to read to their children.
Viewing Assessment Results
Assessment results for math, English language arts, and science are available for the state as well as by school and school district on the Washington State Report Card. Users can also download data files from the Report Card if they are interested in more detail.
Parents and families should contact their child's school or school district for more information about their student's assessment results.