


Understanding Public School Funding
At OSPI, part of our role is helping students, families, educators, and communities understand how education funding works.
School funding can be complicated, but it's an important part of supporting student learning and success. Our goal is to demystify school funding through a series of short explainers and infographics that cover everything from the different sources of funding, to how funding is distributed to how funding models have changed over time.
Topic 1: Where does funding for Washington's public schools come from?
Topic 2: What is the “McCleary case”?
Topic 3: How is public school funding allocated?
Topic 4: What ‘Basic Education’ Funding Does—and Doesn’t—Cover?
Topic 5: How has school funding changed in the years since the McCleary decision?
Topic 1 - Where Does Funding for Washington’s Public Schools Come From?
Washington’s public schools are funded through state revenue (78%), local levies (15%), and federal revenue (7%). Although federal revenue represents only a small share of Washington’s overall education funding, it is vital—making up more than 30% of the budget in some rural school districts. It supports essential programs such as services for students identified as low-income, multilingual/English learners, educator training, and more.
Districts also rely on local levies to provide resources not covered by the state’s basic education funding. Local levies support extracurricular programs (music, sports, clubs), student support services (counselors, nurses, mental health programs), classroom materials, technology, supplies, and staff positions that are not fully funded by the state.
State revenue is the primary source of Washington’s public-school funding. State timber, lottery, and cannabis revenue also contribute to public education. In reality, only a small portion of timber, lottery, and cannabis revenue goes toward K–12 operating funds. Here’s a breakdown:
- Timber Revenue (2023–24 school year)
-
Districts received timber revenue from the following sources:
- County-Administered Forest Revenue: $1,158,569
- State-Administered Forest Revenue: $6,290,720
- Federal Forest Revenue: $7,249,641
- Timber Excise Tax Revenue: $5,306,525
- Lottery Revenue
-
3/4 of all lottery revenue goes toward lottery winnings.
- In the 2023–25 biennium, less than 20% of lottery proceeds ($325 million) went to the Washington Opportunity Pathways Account for Education. About half of that amount ($167 million) supported public schools.
- Cannabis Revenue
-
In total, cannabis funds make up just 0.09% of the state’s K–12 public education budget. Public schools are projected to receive $637,000 in 2026 and $658,000 in 2027.
Cannabis dollars directed to K–12 education primarily support the Building Bridges Program and districts’ life-skills training grants.
For reference, here’s how cannabis revenue was distributed from fiscal year 2015 through 2023:
- 54% supported health care for children enrolled in Medicaid.
- 34% was transferred to the general fund or distributed to local governments. (Funding directed to K–12 public education falls under this category.)
- 12% funded cannabis-related activities.
- Share on Social Media
-
Explore topic 1 and share on social media: Facebook | Instagram | Youtube
Topic 2 - What is ‘McCleary Case’ and Why it’s Important?
Before exploring how funding is allocated, it’s helpful to start with the McCleary case—a major milestone in Washington’s school funding history.
In 2007, the McCleary family filed a lawsuit arguing that the state was not meeting its constitutional duty to make ample provision for public education.
In 2012, the Washington Supreme Court ruled in the family’s favor, stating that Washington state has not provided adequate funding for basic education. A constitutionally sufficient funding model must be developed and implemented.
In response, the Legislature created the prototypical school funding model, which increased state support for K–12 education. This model outlines the formula the state uses to determine most K–12 funding for school districts. We’ll explore this model in the next section.
The Legislature also capped the amount that local school districts could raise through local levies. While the Court required the state to reduce reliance on local levy funding, it did NOT require a levy cap—this was a policy decision made by the Legislature to accompany increased state funding.
Explore topic 2 and share on social media: Facebook | Instagram | Youtube
Topic 3 - How is Public School Funding Allocated?
- Step 1: Calculating the Funding
-
In Washington, most K–12 funding for school districts is determined using the prototypical school funding model.
A prototypical school is a hypothetical model that estimates the staff, materials, and resources needed to operate an average school. The state defines a school size, then calculates how many staff positions are funded based on that size. For full statutory details, see RCW 28A.150.260.
Examples of State-Funded Staff Positions Based on Theoretical School Sizes
Based on the theoretical school sizes above, 1 full-time nurse is funded for schools with:Position Elementary (400 students) Middle (432 students) High School (600 students) Principals 1.253 1.353 1.880 Nurses 0.585 0.888 0.824 Teacher-Librarians 0.663 0.519 0.523 Social Workers 0.311 0.088 0.127 Counselors 0.993 1.716 3.039 - 685 elementary students 487 middle school students 729 high school students
Equitable School Funding Workgroup
In the 2025 Legislative Session, lawmakers passed House Bill 2049, directing OSPI to convene a Workgroup on Equitable School Funding which will:
- Analyze the Prototypical School Funding Model Review other potential funding models Deliver data-driven, actionable recommendations Advise the Legislature on what full and fair school funding should look like.
- Step 2: The State Legislature Provides Funding
-
The Legislature allocates funding to each school district using:
- The Prototypical School Funding Model
- The district’s student enrollment numbers
- Step 3: OSPI Distributes Funding
-
OSPI distributes state funding to school districts and publicly reports all allocations.
Explore funding for any district by using the District Allocation of State Resources Portal on OSPI’s website to view detailed allocations.
- Step 4: Local School Boards Set the Final Budget
-
Although funding is calculated using the Prototypical School Funding Model, districts have significant flexibility in how they spend it. Each local school board is responsible for developing and approving the district’s final budget.
- Share on Social Media
-
Explore topic 3 and share on social media: Facebook | Instagram | Youtube
Topic 4 - What ‘Basic Education’ Funding Does—and Doesn’t—Cover?
Basic Education is defined by state law, and covers learning tools, the educational environment, educators and staff, and some additional learning programs.
- Learning Tools
-
- Books
- Computers
- Other supplies
- Educational Environment
-
- Full-day kindergarten
- Funding provided for 17 students per certificated staff member for grades K–3
- 180 days of school per year
- A district-wide average of 1,000 instructional hours per year for grades K–8, and 1,080 instructional hours per year for high school
- The opportunity to earn 24 credits required for a high school diploma
- Bus transportation for students who live at least one or two miles away from school
- Educators and Staff
-
- Qualified teachers, paid a competitive salary
- Qualified school staff, paid a competitive salary, including principals, teaching assistants, school nurses, guidance counselors, social workers, psychologists, teacher-librarians, office support, custodians, student and staff safety, and family involvement coordinators
- A central office staff that supports schools
- Additional Learning Programs
-
- Special education services for students with disabilities
- A program for students who are multilingual/English learners
- Education for students who would benefit from additional support
- Highly capable programs
- Educational programs for students who are in juvenile detention, a state institution, or a residential school
- Share on Social Media
-
Explore topic 4 and share on social media: Facebook | Instagram | Youtube
Basic education DOES NOT include all aspects that are central to a student's school day. For example, school buildings and their maintenance are not defined in state law as basic education, and neither are school meals.
Topic 5 - How Has School Funding Changed in the Years Since the McCleary Decision?
Remember the McCleary case?
In 2007, the McCleary family sued the state, arguing that Washington was not meeting its constitutional duty to fully fund public education.
In 2012, the Washington State Supreme Court agreed, ruling that the state was violating its constitutional obligation and ordering the Legislature to fully fund basic education by 2018.
By 2019, the Court determined that the Legislature had met its “paramount duty”—marking the peak of Washington’s public-school funding.
What About Now?
Increase in School District Expenditures
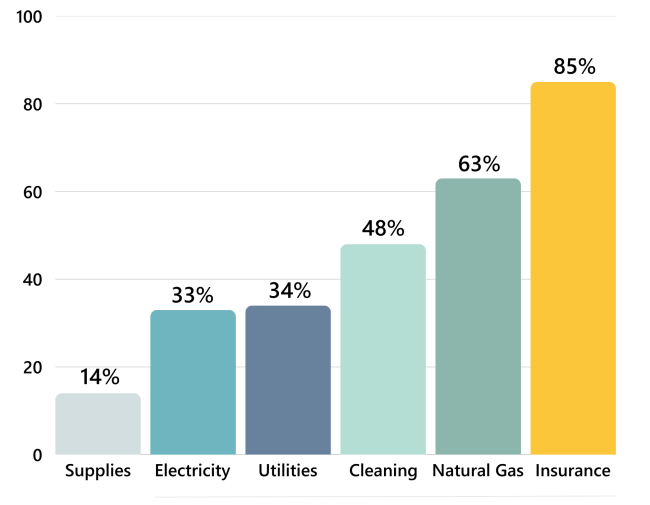
Since 2019, school districts have faced rising maintenance and supply costs, with insurance alone increasing by nearly $50 million statewide annually.
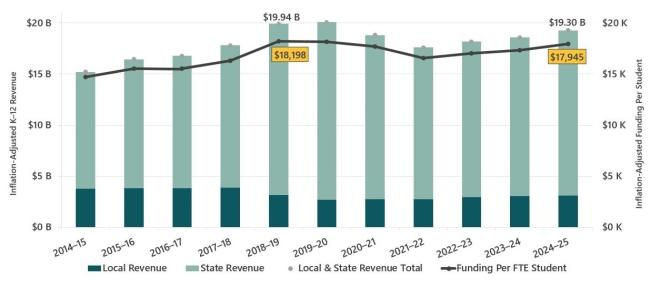
Inflation Adjusted State & Local K-12 Funding Per Student Over Time
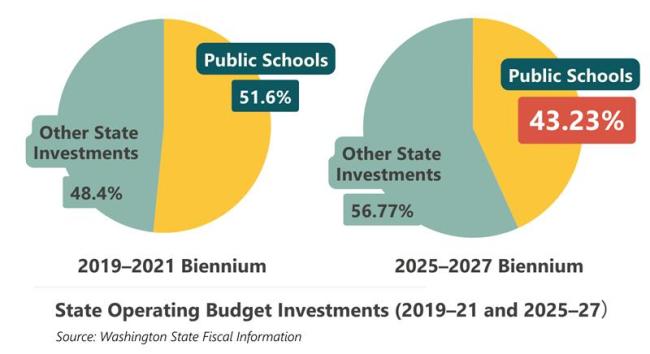
State Operating Budget Investments (2017-19 and 2025-27)
State Investment in K-12 Education as a Percentage of Gross State Product
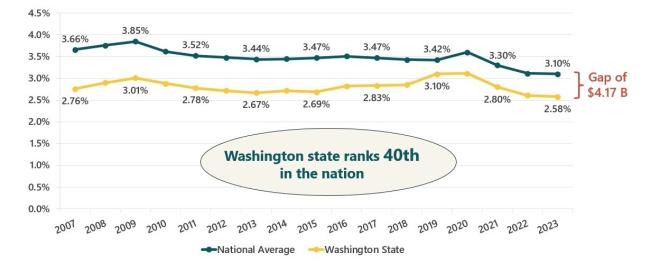
One way of measuring state investments is by taking a look at the percentage of Gross State Product that a
state reinvests in their schools. Over the past two decades, Washington has consistently underinvested in K–12 education at a rate well below the national average.
Explore topic 5 and share on social media: Facebook | Instagram | Youtube
That’s a wrap on our journey of learning about Washington’s public school funding! Thank you for following along — understanding the current structure is just the first step. Let’s keep supporting public education so every student can thrive!